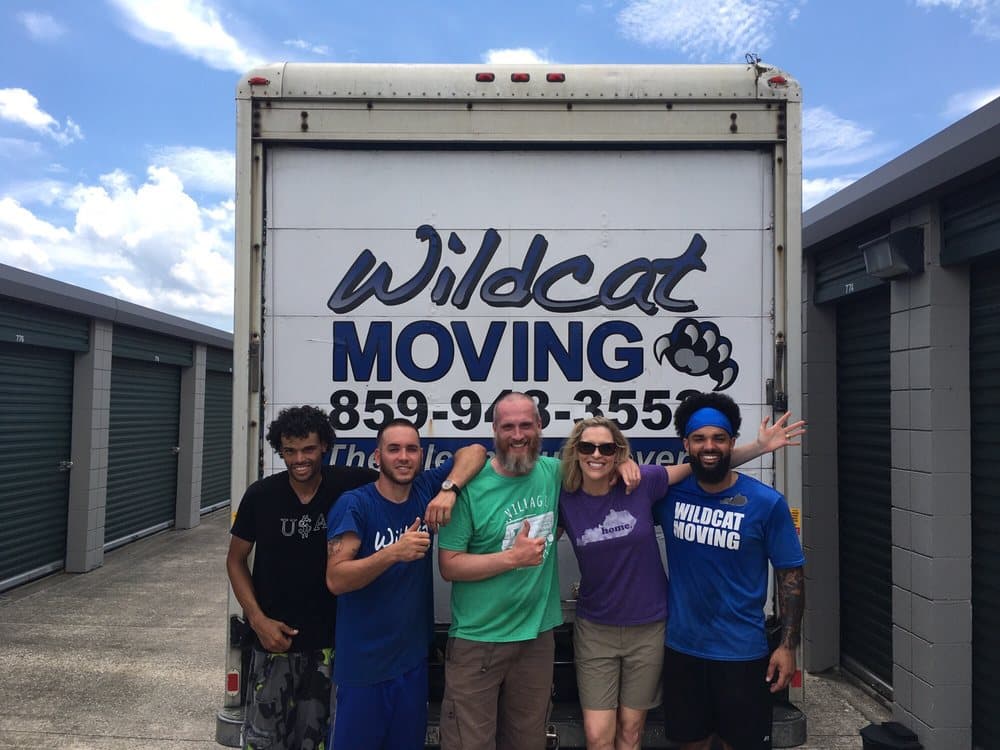

Wildcat Moving

236 Big Run Rd Lexington, KY 40503

DOT 2207083

What began in 2010 with nothing more than a Ford Bronco, a motorcycle trailer, and boundless determination has transformed into one of Kentucky's most respected moving companies. Raleigh "RJ" Bruner, a University of Kentucky MBA graduate, initially viewed moving as a temporary summer gig to stay fit while earning extra income after helping his sister Elisabeth move into her college dorm. This casual beginning quickly revealed a significant gap in the market that Bruner was uniquely positioned to fill. For nearly fifteen years, Wildcat Moving has revolutionized the Kentucky moving industry by adhering to three fundamental principles: punctuality, quality workmanship, and fair pricing. While competitors relied on fancy trucks and elaborate websites, Bruner focused on service excellence and customer satisfaction—a strategy that has paid remarkable dividends. What truly distinguishes Wildcat Moving is not just their impressive evolution from a single vehicle to a fleet of twenty-four moving trucks and eight marketing vehicles, but their pioneering legal battle that transformed the entire industry. When established moving companies attempted to prevent Wildcat from operating without a "certificate of necessity"—an antiquated regulatory tool that stifled competition—Bruner refused to surrender. Partnering with the Pacific Legal Foundation, he successfully challenged this anti-competitive practice, resulting in a federal judge declaring it unconstitutional. This landmark legal victory opened doors for numerous moving companies to enter the marketplace, fostering fair competition and better services throughout Kentucky. Today, Wildcat Moving continues its community-focused approach while maintaining the same core values that drove its initial success. Under Bruner's leadership, the company has expanded to include specialized services through sister company Ladycat Packing & Organizing, and Wildcat Van Lines for long-distance relocations anywhere in the continental United States. With multiple storage facilities in Lexington and Nicholasville, they offer comprehensive moving solutions while remaining true to their founding vision of providing exceptional service at reasonable rates.

Company Image
Company avatar

FMCSA Company Profile

Years in Business: 13 years (First Registered in Nov. 2011)

Last Report Filed: 2 years ago

Company Information

Legal Name
wildcat moving llc
DOT Number
2207083
Entity Type
Carrier

Company Officers

Officer 1
raleigh bruner

Cargo Types

Household Goods

Safety Information

Detailed safety guidelines and procedures to ensure compliance and minimize risks.

Performance measures

High-level performance indicators to quickly assess the company's scale.

Unsafe driving
Total Violations
Driver hours of service
No OOS Violations
OOS Violations
Driver Fitness
Vehicle Maintenance
What does this mean?
The chart highlights five key safety measures used to assess and improve operational safety in transportation.
Total Violations: The total number of violations recorded, including both Out of Service (OOS) and non-OOS violations.
Out of Service (OOS) Violations: Violations serious enough to temporarily prohibit a driver or vehicle from operating until the condition is corrected.
Non-OOS Violations: Violations that are documented but do not require immediate cessation of operations.
Driver Fitness: Violations related to driver qualifications, including medical certificates, CDL requirements, and proper documentation.
Unsafe Driving: Operating violations such as speeding, improper lane changes, and failure to obey traffic control devices.
Hours of Service: Violations of driving time limitations and required rest periods to prevent driver fatigue.
Vehicle Maintenance: Violations related to vehicle condition, including brakes, lights, cargo securement, and other mechanical issues.
The risk score evaluates each carrier's safety performance, combining key factors to provide a comprehensive safety assessment.
Purpose of the Risk Score: The score identifies carriers with higher safety risks by analyzing critical safety factors and providing actionable insights for improvement.
Factors Included in the Score: Combines unsafe driving, hours of service, driver fitness, substance use, and vehicle maintenance measures into a single metric.
Weight Distribution: Each factor is weighted based on its impact on safety, with unsafe driving and compliance having the highest influence.
Data Sources: Derived from regulatory records, inspection results, and carrier-reported data, ensuring a robust and accurate evaluation.
Use of the Risk Score: Helps stakeholders identify high-risk carriers, prioritize interventions, and promote safer practices across the transportation industry.

Monthly Risk Score

5 measures combined monthly score

Crash Rate

0

Based on recordable crashes per vehicle
100% Lower

than national average.

Key Metrics

High-level performance indicators to quickly assess the company's scale and activity.

Annual Miles (2022)

185,000

Filled:
14/03/2023

Driver Satistics

22

Total Drivers

0

CDL (N/A)

Fleet Size:
I
- 20-23

22

Trucks

22

Power Units

Drivers

Overview of vehicle assets and their allocation for operational needs.

Driver Distribution

Overview of driver allocation for interstate and intrastate routes, helping identify resource distribution.

In-State:
22

Distance Breakdown

Analysis of trip distances categorized by interstate (cross-State) and intrastate (in-State) operations to optimize planning.

Fleet

Essential insights into the composition and reach of the driver workforce.

Fleet Information

Fleet Size: I

Breakdown of fleet composition, including owned and leased vehicles, to assess operational capacity.

Inspections

Report #
State
Date
Driver Violations
Vehicle Violations
Unsafe Driving
Driver Fatigue
Substances/Alcohol
Vehicle Maint.
0S14203633KY2024-11-06000000
CV43886933KY2023-11-08001000
CV41293910KY2023-09-11001000
CV43402553KY2023-04-12001000
CV43886012KY2023-03-15001000
S196001000KY2023-02-24000000
L751000041KY2023-02-24010001
CV43741618KY2022-08-23000000
Showing 1 of 3

Inspections per year

Inspections per 100K miles (2022)

10

Total Inspections

18

Safety Inspection Results

Failed Safety Inspections

1

8% Higher

than national average.

Driver-Related Safety Failures

0

5% Lower

than national average.

Vehicle-Related Safety Failures

1

9% Higher

than national average.

Inspection Map
Visualization of inspection data across the United States.

Violations

Insp DateCategorySevere FailureViolation Details
Showing 1 of 4

Violations per 100K miles

20

100% Lower

than national average.

Total Violations

37

196% Higher

than national average.