Verified Partner

Square Cow & Storage Austin

Austin, TX

DOT number: 1748594

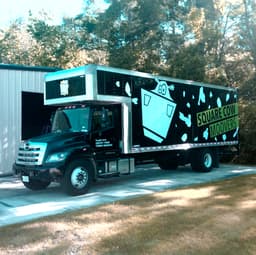
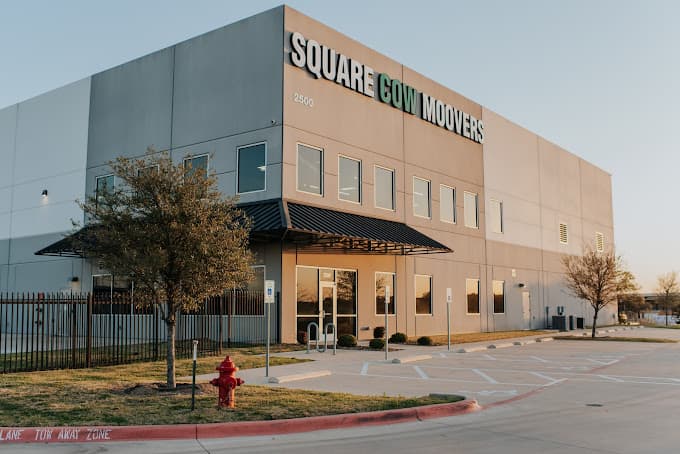
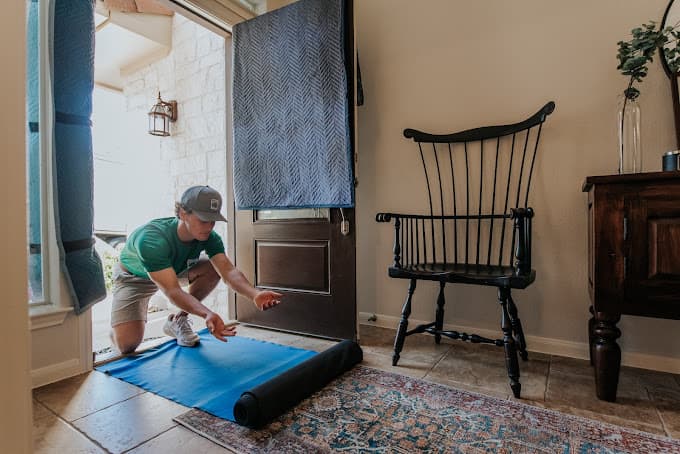
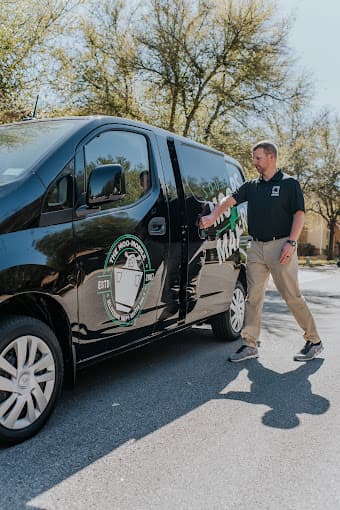
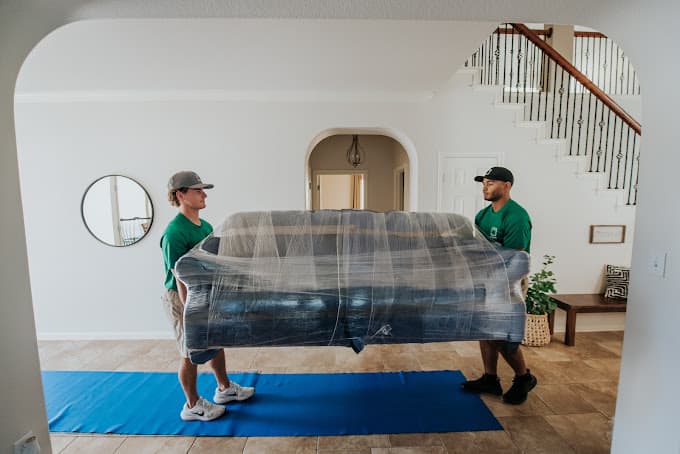
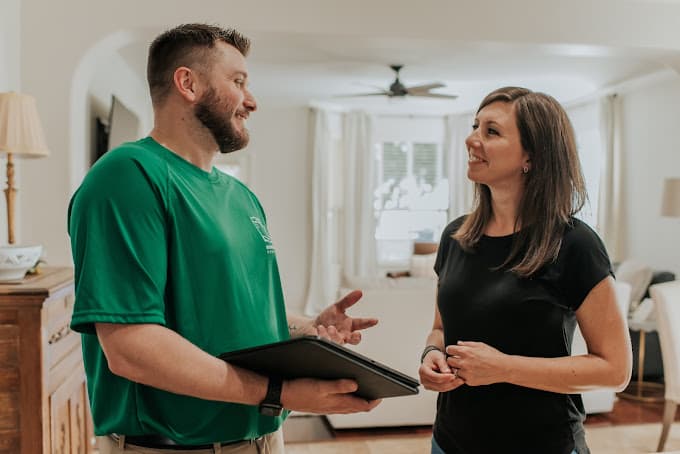
Square Cow is a family-owned moving company in Austin, TX. Their story is one you might have heard before. In 2007, this family decided to move to this state. However, their experience with their movers left a sour taste in their mouths. Sound familiar? Pushed by this experience, they decided to start their own moving company to do better. That's how, in 2008, Square Cow Movers was born. It wasn't an overnight success. It took time, but their commitment to seeing it through bore its fruits. Today, Square Cow has seven branches across two states. With hundreds of professional employees in their herd, they can provide many different services to fit your needs. With their local moves, you can move across the street or the city in no time at all. You can do the same with their long-distance ones but even go as far as crossing the country. They can help you pack to ensure all your fragile belongings are protected and won't be damaged when on the move. Even if you prefer to take this task on yourself, they can provide you with the necessary supplies. They also offer labor-only movers. All of this and more is available to both commercial and residential clients.
Company Image
Company avatar

Company Profile

Years in Business: 17 years

Last Update: 1 year

Company Information

Legal Name
square cow moovers llc
DBA Name
revenge of the herds llc
DOT Number
1748594
Entity Type
Carrier

Company Officers

Officer 1
james wayne lombard

Filing Information

MSC-150 Date
29/03/2023
Added Date
14/03/2008

Cargo Types

Household Goods

Safety Information

Detailed safety guidelines and procedures to ensure compliance and minimize risks.

Performance measures

High-level performance indicators to quickly assess the company's scale.

Unsafe driving
Total Violations
Driver hours of service
No OOS Violations
OOS Violations
Driver Fitness
Vehicle Maintenance
What does this mean?
The chart highlights five key safety measures used to assess and improve operational safety in transportation.
Total Violations: The total number of violations recorded, including both Out of Service (OOS) and non-OOS violations.
Out of Service (OOS) Violations: Violations serious enough to temporarily prohibit a driver or vehicle from operating until the condition is corrected.
Non-OOS Violations: Violations that are documented but do not require immediate cessation of operations.
Driver Fitness: Violations related to driver qualifications, including medical certificates, CDL requirements, and proper documentation.
Unsafe Driving: Operating violations such as speeding, improper lane changes, and failure to obey traffic control devices.
Hours of Service: Violations of driving time limitations and required rest periods to prevent driver fatigue.
Vehicle Maintenance: Violations related to vehicle condition, including brakes, lights, cargo securement, and other mechanical issues.
The risk score evaluates each carrier's safety performance, combining key factors to provide a comprehensive safety assessment.
Purpose of the Risk Score: The score identifies carriers with higher safety risks by analyzing critical safety factors and providing actionable insights for improvement.
Factors Included in the Score: Combines unsafe driving, hours of service, driver fitness, substance use, and vehicle maintenance measures into a single metric.
Weight Distribution: Each factor is weighted based on its impact on safety, with unsafe driving and compliance having the highest influence.
Data Sources: Derived from regulatory records, inspection results, and carrier-reported data, ensuring a robust and accurate evaluation.
Use of the Risk Score: Helps stakeholders identify high-risk carriers, prioritize interventions, and promote safer practices across the transportation industry.

Monthly Risk Score

5 measures combined monthly score

Crash Rate

0

Based on recordable crashes per vehicle
100% Lower

than national average.

Key Metrics

High-level performance indicators to quickly assess the company's scale and activity.

Annual Miles (2022)

1,050,000

Filled:
29/03/2023

Driver Satistics

84

Total Drivers

0

CDL (N/A)

Fleet Size:
O
- 56-75

62

Trucks

62

Power Units

Drivers

Overview of vehicle assets and their allocation for operational needs.

Driver Distribution

Overview of driver allocation for interstate and intrastate routes, helping identify resource distribution.

Interstate:
35
Intrastate:
49
Interstate42%Intrastate58%

Distance Breakdown

Analysis of trip distances categorized by interstate (cross-State) and intrastate (in-State) operations to optimize planning.

Fleet

Essential insights into the composition and reach of the driver workforce.

Fleet Information

Fleet Size: O

Breakdown of fleet composition, including owned and leased vehicles, to assess operational capacity.

Inspections

Report #
State
Date↓
Driver Violations
Vehicle Violations
Unsafe Driving
Driver Fatigue
Substances/Alcohol
Vehicle Maint.
PCAJ000474WY2024-11-22000000
8040000395AR2024-09-12000000
I204154609OK2024-07-18000000
I204154508OK2024-05-30001001
1280000292GA2024-05-26000000
I204154317OK2024-04-03000000
469D011848AR2023-07-18000000
NDUF004131CA2023-06-25000000
Showing 1 of 5

Inspections per year

Inspections per 100K miles (2022)

4

Total Inspections

38

Safety Inspection Results

Failed Safety Inspections

0

5% Lower

than national average.

Driver-Related Safety Failures

0

5% Lower

than national average.

Vehicle-Related Safety Failures

0

4% Lower

than national average.

Inspection Map
Visualization of inspection data across the United States.

Violations

Insp DateCategorySevere FailureViolation Details
Showing 1 of 5

Violations per 100K miles

4

100% Lower

than national average.

Total Violations

44

252% Higher

than national average.

Crashes

REPORT #
DATE↓
STATE
FATALITIES
INJURIES
TOW AWAY
LICENSE NUMBER
TX64UAHQE1A101-OCT-21TX00YJNV1532

Amount of Crashes

1

Fatalities

0

Injuries

0

Number of Tows

1

Tow Rate:
100.0%
Number of fatalities per year
Number of injuries per year

Incidents by season

Incidents by weather condition

Incidents by road surface condition

Incidents by light condition

Crash Map
Visualization of crashes data across the United States.