Annual Miles (2023)
59,917
512 W Simpson St, Mechanicsburg, PA 17055. Founded 7 years ago by mark howard heishman
Mon-Sat: 09:00-17:00
Sun: 08:00-12:00
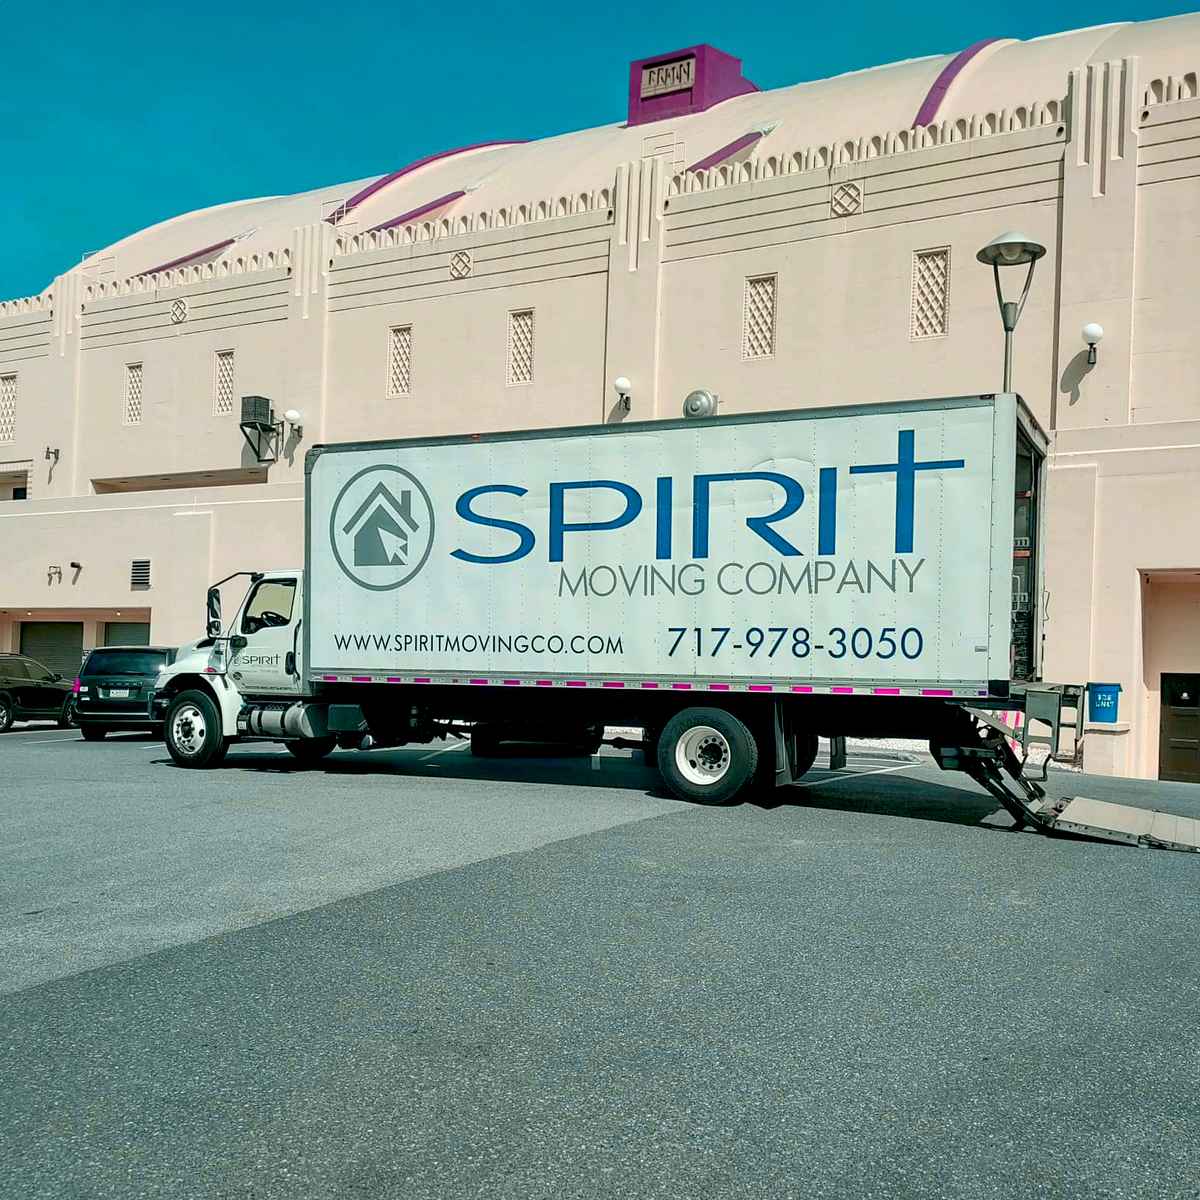
Fleet
2
trucks
Experience
7
years
Average Rate
0.0(0 reviews)
Be the first to share your experience!
All data is sourced from the Federal Motor Carrier Safety Administration (FMCSA).
Company Profile
Years in Business: 7 years•First Registered in Nov 2018
Company Information
Legal Name
spirit moving company llc
DOT Number
3214709
Registration Date
2018-21-11
Entity Type
C
Filing Information
Last Government Update
2024-28-08
Cargo Types
Company Officer
Company Officer
mark howard heishman
High-level performance indicators to quickly assess the company's scale and activity.
59,917
4
Total Drivers
2
CDL Drivers
2
Total Trucks
Detailed safety guidelines and procedures to ensure compliance and minimize risks.
8
Total Inspections
5
Clean Inspections
62.5%
Inspection Pass Rate
Safety Analysis
Spirit Moving Company operates a fleet of 2 trucks and 4 drivers, logging over 59,917 miles in 2023.
62.5%Below Average
Clean Inspection Rate
8
Total Inspections
5
Passed Clean
3
With Notes
Recent Inspections
2024-08-11
PA
Clean
2024-04-22
NC
Clean
!
2023-01-12
TN
Minor notes
!
2023-01-12
TN
Minor notes
Data sourced from FMCSA government records
Post your job opening and connect with qualified candidates.
Verified
Fast matching
2,500+ companies
Business Name | Years Running | Owner's Name | DOT # | Trucks ↓ | Drivers | Miles/Year | Address |
|---|---|---|---|---|---|---|---|
napa transportation inc | 35 | ronald accomando | 446997 | 389 | 365 | 35562000 | 4800 east trindle road, mechanicsburg, pa 17055-0959 |
36 | laurence o'toole | 373544DOT Record | 88 | 253 | 5000000 | 7 mckay ave, winchester, ma 1890 | |
edo's trucking inc | 21 | jasna ljuca | 1327266 | 52 | 45 | 4802994 | 12 long lane, mechanicsburg, pa 17050 |
a c k deliveries llc | 5 | kwame ruffin | 3522997 | 20 | 20 | 0 | 5451 pentridge st, philadelphia, pa 19143-4125 |
remarkable solutions inc | 7 | avi turgeman | 3208047 | 20 | 1 | 180000 | 1701 s 25th st, philadelphia, pa 19145 |
towaway express inc | 40 | thomas s sheaffer | 265753 | 20 | 20 | 1803842 | 18 brenneman circle, mechanicsburg, pa 17050 |
16 | samuel michael shovel | 1989213DOT Record | 20 | 20 | 23000 | 1804 trinity valley drive, carrolton, tx 75006 | |
52 | kevin m riley | 85429DOT Record | 17 | 9 | 192760 | 9800 ashton rd, philadelphia, pa 19114 |