Verified Partner

Safe Responsible Movers

24 Denby Rd #28 Boston, MA 02134, Boston, MA

DOT number: 2207440

Chris Amaral and his team move stuff around—your stuff and other Bostonians' stuff—and they are really good at it. Ask any clients who've had to move to a new place or office in Boston, Cambridge, South Shore, or Cape Cod. Safe Responsible Movers has over a hundred reviews on Google, resulting in a 4.9 rating. And on Yelp, they've got close to three hundred reviews with the same rating. Those are some pretty good numbers. Considering them, odds are you can safely trust these guys with your personal belongings. But suppose those are not enough reasons for you. In that case, they are licensed by the Massachusetts Department of Public Utilities and have full insurance coverage for safe handling. To their residential clients, they offer movers to relocate households, apartments, college dorms, single items, senior citizens, and even in-home moves. They can also provide labor-only services for moves where you already have a truck, POD loading, and overnight storage. Last-minute moves are a possibility, too! To their commercial clients, they offer office and retail relocation services. There's also a crew to help designers stage homes. Ultimately, if you've got to choose, choose the top choice, according to The Improper Bostonian.
Company Image
Company avatar

Company Profile

Years in Business: 13 years

Last Update: 3 years

Company Information

Legal Name
chris amaral
DBA Name
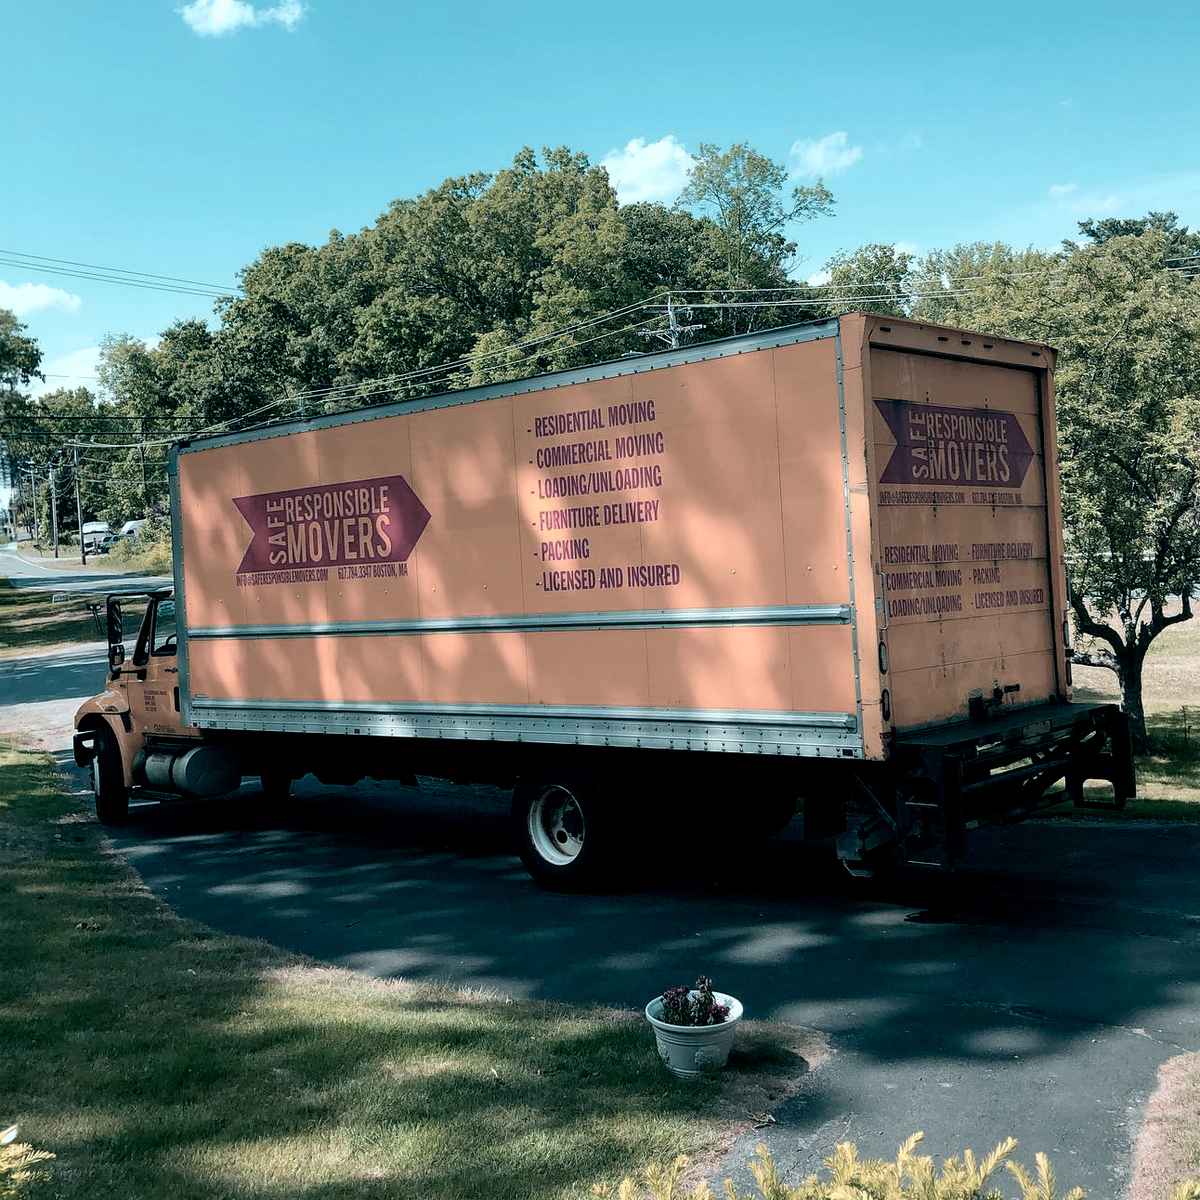
safe responsible movers
DOT Number
2207440
Entity Type
Carrier

Contact Information

Phone Number
6177843347
Cell Number
6177843347

Company Officers

Officer 1
chris amaral

Filing Information

MSC-150 Date
20/07/2021
Added Date
03/11/2011

Cargo Types

Household Goods

Safety Information

Detailed safety guidelines and procedures to ensure compliance and minimize risks.

Performance measures

High-level performance indicators to quickly assess the company's scale.

Unsafe driving
Total Violations
Driver hours of service
No OOS Violations
OOS Violations
Driver Fitness
Vehicle Maintenance
What does this mean?
The chart highlights five key safety measures used to assess and improve operational safety in transportation.
Total Violations: The total number of violations recorded, including both Out of Service (OOS) and non-OOS violations.
Out of Service (OOS) Violations: Violations serious enough to temporarily prohibit a driver or vehicle from operating until the condition is corrected.
Non-OOS Violations: Violations that are documented but do not require immediate cessation of operations.
Driver Fitness: Violations related to driver qualifications, including medical certificates, CDL requirements, and proper documentation.
Unsafe Driving: Operating violations such as speeding, improper lane changes, and failure to obey traffic control devices.
Hours of Service: Violations of driving time limitations and required rest periods to prevent driver fatigue.
Vehicle Maintenance: Violations related to vehicle condition, including brakes, lights, cargo securement, and other mechanical issues.
The risk score evaluates each carrier's safety performance, combining key factors to provide a comprehensive safety assessment.
Purpose of the Risk Score: The score identifies carriers with higher safety risks by analyzing critical safety factors and providing actionable insights for improvement.
Factors Included in the Score: Combines unsafe driving, hours of service, driver fitness, substance use, and vehicle maintenance measures into a single metric.
Weight Distribution: Each factor is weighted based on its impact on safety, with unsafe driving and compliance having the highest influence.
Data Sources: Derived from regulatory records, inspection results, and carrier-reported data, ensuring a robust and accurate evaluation.
Use of the Risk Score: Helps stakeholders identify high-risk carriers, prioritize interventions, and promote safer practices across the transportation industry.

Monthly Risk Score

5 measures combined monthly score

Crash Rate

0

Based on recordable crashes per vehicle
100% Lower

than national average.

Key Metrics

High-level performance indicators to quickly assess the company's scale and activity.

Annual Miles (2020)

20,000

Filled:
20/07/2021

Driver Satistics

3

Total Drivers

N/A

CDL (N/A)

Fleet Size:
B
- Bus

2

Trucks

2

Power Units

Drivers

Overview of vehicle assets and their allocation for operational needs.

Driver Distribution

Overview of driver allocation for interstate and intrastate routes, helping identify resource distribution.

Intrastate:
3
Intrastate100%

Distance Breakdown

Analysis of trip distances categorized by interstate and intrastate operations to optimize planning.

Fleet

Essential insights into the composition and reach of the driver workforce.

Fleet Information

Fleet Size: B

Breakdown of fleet composition, including owned and leased vehicles, to assess operational capacity.

Inspections

Report #
State
Date↓
Driver Violations
Vehicle Violations
Unsafe Driving
Driver Fatigue
Substances/Alcohol
Vehicle Maint.
CY00002167MA2024-06-05002001
CM00002421MA2021-07-18101011
CB00005434MA2020-08-11010006

Inspections per year

Inspections per mile (2020)

0.00015

Total Inspections

3

Safety Inspection Results

Failed Safety Inspections

2

62% Higher

than national average.

Driver-Related Safety Failures

1

28% Higher

than national average.

Vehicle-Related Safety Failures

1

29% Higher

than national average.

Violations

Insp DateCategorySevere FailureViolation Details
Showing 1 of 4

Violations per mile

0

100% Lower

than national average.

Total Violations

38

204% Higher

than national average.