Verified Partner

Managed Moves

7136 13446 NE Whitaker Way Portland, OR 97230

DOT number: 2899598

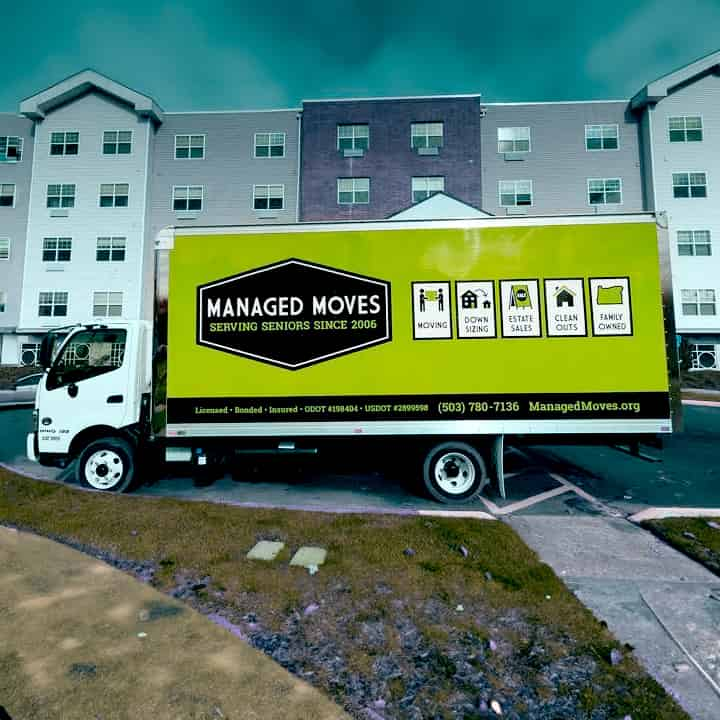
Managed Moves is a full-service moving company with a quirk. This professional team is the only one in Portland that solely serves seniors. They've been doing this since 2006 with great success. With over 15 years of experience, they can execute close to 2,000 moves per year. In 2021, Managed Moves was voted one of the best moving companies in Portland on Expertise.com. All work is done exclusively by its crew, without outsourcing. Plus, all employees are background-checked. Portland's senior citizens deserve a group of professionals dedicated to easing their transitions. This company's owners, Krista Giudici and Steve Klemroth, wanted to give them that. It was the least they could do. That's also why they offer a comprehensive suite of services. These guys can be there from the start, providing their expertise to ease your stress. They can help downsize decades of accumulated stuff, sort everything out, and prepare it to be packed. After step #1, these specialists can safely pack, load, and transport your home to its new destination. They do both intrastate moves and apartment transfers. Another service they provide is estate cleanouts. You might be thinking their rates must be astronomical. However, as a licensed company, its prices are set by the state of Oregon.
Company Image
Company avatar

FMCSA Company Profile

Years in Business: 8 years (First Registered in Jun. 2016)

Last Report Filed: Less than 1 year ago ago

Company Information

Legal Name
managed moves llc
DBA Name
managed moves
DOT Number
2899598
Entity Type
Carrier

Company Officers

Officer 1
steve klemroth / managed moves

Cargo Types

Household Goods

Safety Information

Detailed safety guidelines and procedures to ensure compliance and minimize risks.

Performance measures

High-level performance indicators to quickly assess the company's scale.

Unsafe driving
Total Violations
Driver hours of service
No OOS Violations
OOS Violations
Driver Fitness
Vehicle Maintenance
What does this mean?
The chart highlights five key safety measures used to assess and improve operational safety in transportation.
Total Violations: The total number of violations recorded, including both Out of Service (OOS) and non-OOS violations.
Out of Service (OOS) Violations: Violations serious enough to temporarily prohibit a driver or vehicle from operating until the condition is corrected.
Non-OOS Violations: Violations that are documented but do not require immediate cessation of operations.
Driver Fitness: Violations related to driver qualifications, including medical certificates, CDL requirements, and proper documentation.
Unsafe Driving: Operating violations such as speeding, improper lane changes, and failure to obey traffic control devices.
Hours of Service: Violations of driving time limitations and required rest periods to prevent driver fatigue.
Vehicle Maintenance: Violations related to vehicle condition, including brakes, lights, cargo securement, and other mechanical issues.

Crash Rate

0

Based on recordable crashes per vehicle
100% Lower

than national average.

Key Metrics

High-level performance indicators to quickly assess the company's scale and activity.

Annual Miles (2023)

50,000

Filled:
03/05/2024

Driver Satistics

5

Total Drivers

0

CDL (N/A)

Fleet Size:
C
- 4-6

4

Trucks

4

Power Units

Drivers

Overview of vehicle assets and their allocation for operational needs.

Driver Distribution

Overview of driver allocation for interstate and intrastate routes, helping identify resource distribution.

Intrastate:
5

Distance Breakdown

Analysis of trip distances categorized by interstate (cross-State) and intrastate (in-State) operations to optimize planning.

Fleet

Essential insights into the composition and reach of the driver workforce.

Fleet Information

Fleet Size: C

Breakdown of fleet composition, including owned and leased vehicles, to assess operational capacity.

Inspections

Report #
State
Date↓
Driver Violations
Vehicle Violations
Unsafe Driving
Driver Fatigue
Substances/Alcohol
Vehicle Maint.
AANG000460OR2023-09-11000000
000S759935OR2019-10-21001000

Inspections per year

Inspections per 100K miles (2023)

4

Total Inspections

2

Safety Inspection Results

Failed Safety Inspections

0

5% Lower

than national average.

Driver-Related Safety Failures

0

5% Lower

than national average.

Vehicle-Related Safety Failures

0

4% Lower

than national average.

Inspection Map
Visualization of inspection data across the United States.

Violations

Insp DateCategorySevere FailureViolation Details

Violations per 100K miles

4

100% Lower

than national average.

Total Violations

2

84% Lower

than national average.

Crashes

REPORT #
DATE↓
STATE
FATALITIES
INJURIES
TOW AWAY
LICENSE NUMBER
OR202226016720-DEC-22OR01NT615740

Amount of Crashes

1

Injury Crashes
1

Fatalities

0

Injuries

1

Injury Rate:
20.00

Number of Tows

0

Number of fatalities per year
Number of injuries per year

Incidents by season

Incidents by weather condition

Incidents by road surface condition

Incidents by light condition

Crash Map
Visualization of crashes data across the United States.