Annual Miles (2024)
60,000
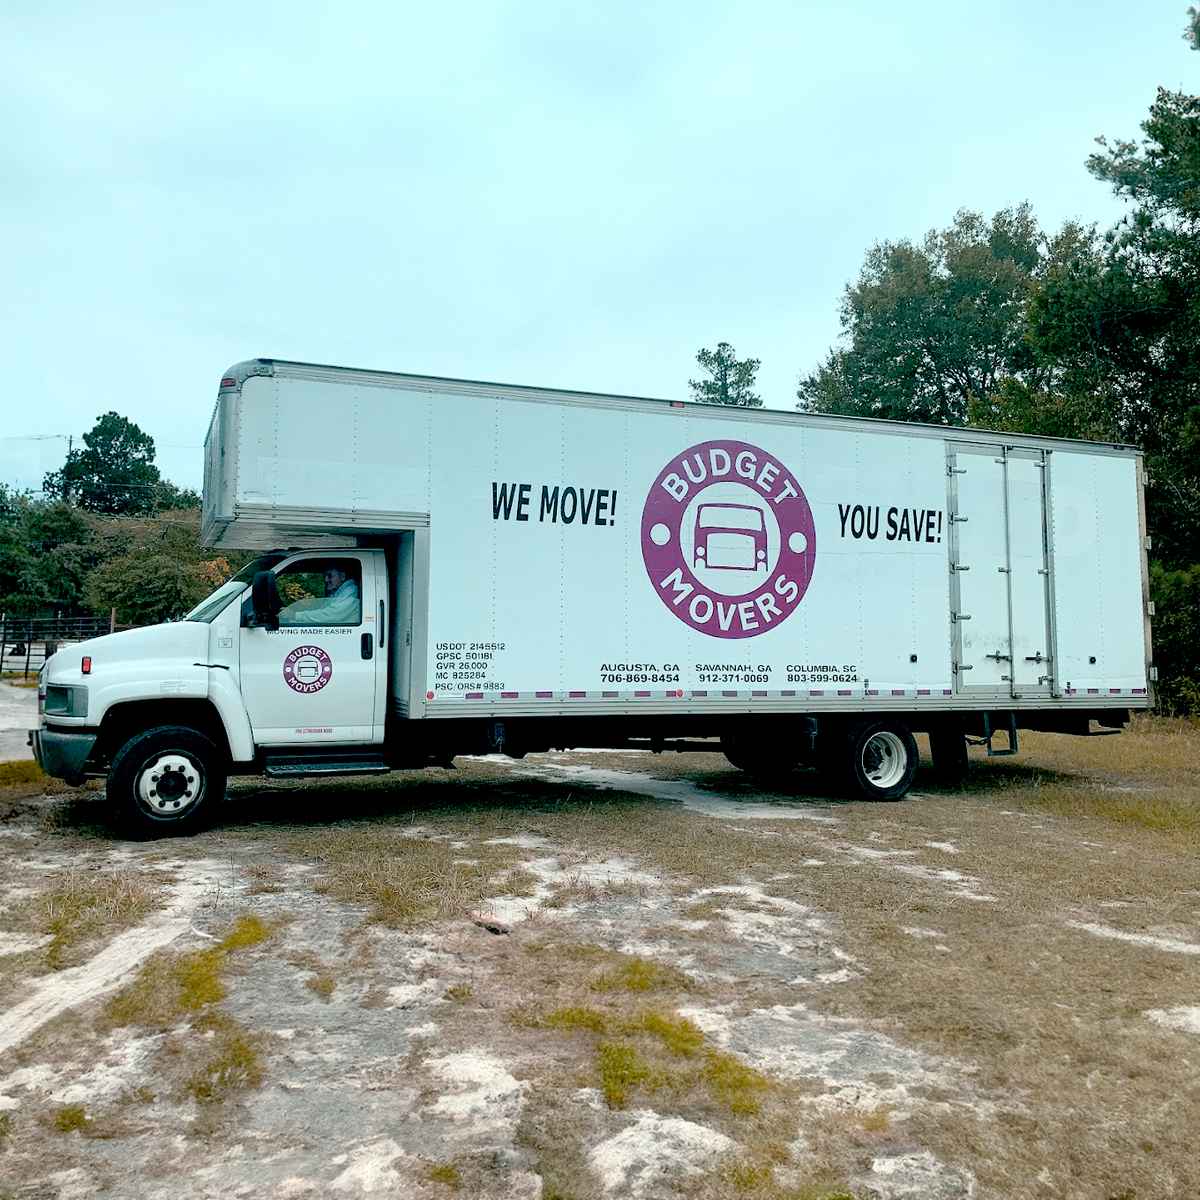
4001 McDaniel Rd # A, Augusta, GA 30909. Founded 14 years ago by james furlong
Mon-Sat: 08:00-17:00
Fleet
6
trucks
Experience
14
years
Average Rate
0.0(0 reviews)
Be the first to share your experience!
All data is sourced from the Federal Motor Carrier Safety Administration (FMCSA).
Company Profile
Years in Business: 14 years•First Registered in Apr 2011
Company Information
Legal Name
budget movers of augusta inc
DOT Number
2145512
Registration Date
2011-21-04
Entity Type
C
Filing Information
Last Government Update
2025-09-04
Cargo Types
Company Officer
Company Officer
james furlong
High-level performance indicators to quickly assess the company's scale and activity.
60,000
8
Total Drivers
0
CDL Drivers
6
Total Trucks
Detailed safety guidelines and procedures to ensure compliance and minimize risks.
23
Total Inspections
18
Clean Inspections
78.3%
Inspection Pass Rate
Safety Analysis
Budget Movers operates a fleet of 6 trucks and 8 drivers, logging over 60,000 miles in 2024.
78.3%Average
Clean Inspection Rate
23
Total Inspections
18
Passed Clean
5
With Notes
Recent Inspections
2025-09-30
GA
Clean
2025-07-29
GA
Clean
!
2025-06-27
GA
Minor notes
2025-05-19
GA
Clean
Data sourced from FMCSA government records
Post your job opening and connect with qualified candidates.
Verified
Fast matching
2,500+ companies
Business Name | Years Running | Owner's Name | DOT # | Trucks ↓ | Drivers | Miles/Year | Address |
|---|---|---|---|---|---|---|---|
27 | brian ellefson | 754250DOT Record | 16 | 16 | 42000 | 3122 mike padgett hwy, augusta, ga 30906 | |
24 | robert michael thompson | 955615DOT Record | 12 | 11 | 138000 | 3520 wrightsboro rd, augusta, ga 30909-2435 | |
14 | james furlong | 2145512DOT Record | 8 | 8 | 80000 | 4001 a mcdaniel rd, augusta, ga 30909 | |
h & s transfer company inc | 51 | kenneth heyman | 92748 | 6 | 5 | 11363 | 1240 gordon park rd, augusta, ga 30901-3830 |
southland paper inc | 22 | jason crews | 1186643 | 5 | 5 | 88350 | 1212 new savannah rd, augusta, ga 30901 |
anthony's moving inc | 16 | james furlong | 1877401 | 4 | 4 | 0 | 4059 mcdaniel road, augusta, ga 30909 |
51 | brian d. ellefson | 92674DOT Record | 3 | 4 | 19500 | 3122 mike padgett hwy, augusta, ga 30906 | |
furniture doctor inc | 29 | walter smith | 640877 | 3 | 4 | 39700 | 3345 peach orchard rd, augusta, ga 30906 |