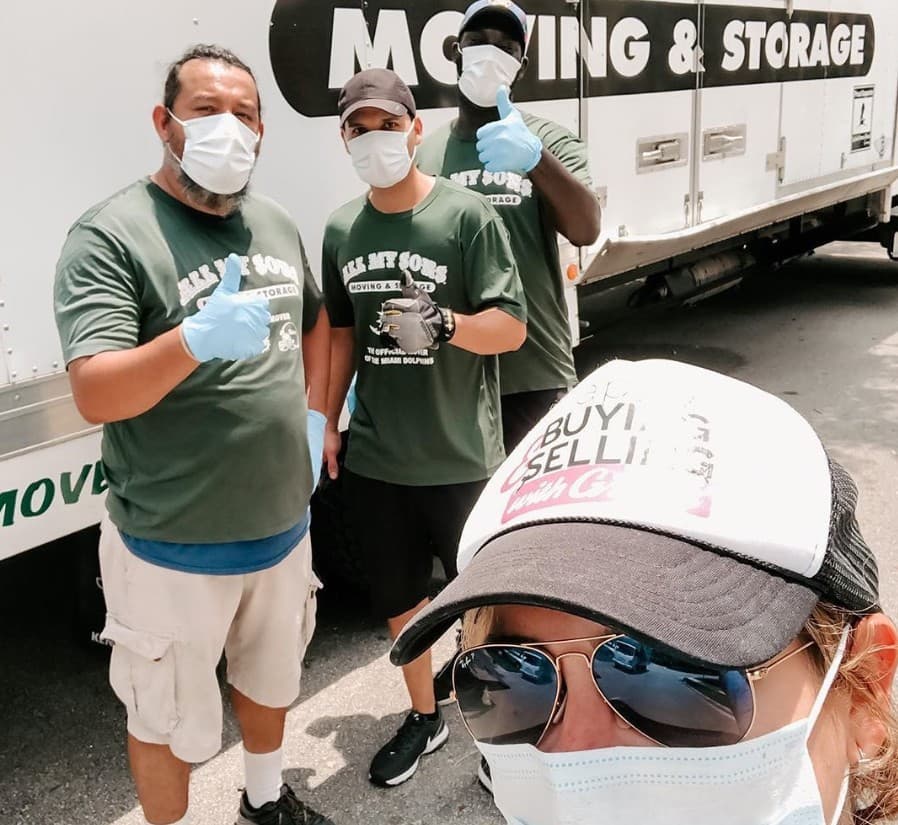
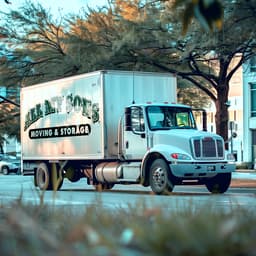
All My Sons Moving & Storage

4012 W Turney Ave b1, Phoenix, AZ 85019

DOT 1981150

All My Sons Moving has been making Phoenix relocations a breeze for over 40 years, earning their spot as the go-to movers for homes and businesses alike. This tight-knit family business stands out by treating customers like their own relatives—no cookie-cutter approaches here. Their crew doesn't just toss things in boxes; they've mastered the art of wrapping, packing, and transporting everything from grandma's china to office equipment with the care it deserves. What makes them special? They've somehow cracked the code on being both big enough to handle any move (even international ones) while still remembering your name and your dog's favorite hiding spot on moving day. Their services cover all the bases—local moves across town, cross-country hauls, overseas shipping, secure storage units, business relocations, and specialty packing for those items that keep you up at night worrying. Their teams actually show up when they say they will (imagine that!), take apart your furniture and put it back together without mysterious leftover screws, tell you exactly what you'll pay without surprise fees, and genuinely seem to care about making your move day suck less. They've figured out how to be pros without being robots, handling the heavy lifting while adding that human touch that turns a typically chaotic moving experience into something that might not make you break into a cold sweat after all.
Company Image

Office location

4012 W Turney Ave b1, Phoenix, AZ 85019

Company avatar

FMCSA Company Profile

Years in Business: 15 years (First Registered in Jan. 2010)

Last Report Filed: 1 year ago

Company Information

Legal Name
all my sons moving & storage of phoenix llc
DOT Number
1981150
Entity Type
Carrier

Company Officers

Officer 1
chris generale

Cargo Types

Household Goods

Safety Information

Detailed safety guidelines and procedures to ensure compliance and minimize risks.

Performance measures

High-level performance indicators to quickly assess the company's scale.

Unsafe driving
Total Violations
Driver hours of service
No OOS Violations
OOS Violations
Driver Fitness
Vehicle Maintenance
What does this mean?
The chart highlights five key safety measures used to assess and improve operational safety in transportation.
Total Violations: The total number of violations recorded, including both Out of Service (OOS) and non-OOS violations.
Out of Service (OOS) Violations: Violations serious enough to temporarily prohibit a driver or vehicle from operating until the condition is corrected.
Non-OOS Violations: Violations that are documented but do not require immediate cessation of operations.
Driver Fitness: Violations related to driver qualifications, including medical certificates, CDL requirements, and proper documentation.
Unsafe Driving: Operating violations such as speeding, improper lane changes, and failure to obey traffic control devices.
Hours of Service: Violations of driving time limitations and required rest periods to prevent driver fatigue.
Vehicle Maintenance: Violations related to vehicle condition, including brakes, lights, cargo securement, and other mechanical issues.

Crash Rate

0

Based on recordable crashes per vehicle
100% Lower

than national average.

Key Metrics

High-level performance indicators to quickly assess the company's scale and activity.

Annual Miles (2022)

363,451

Filled:
14/12/2023

Driver Satistics

5

Total Drivers

0

CDL (N/A)

Fleet Size:
F
- 12-14

12

Trucks

12

Power Units

Drivers

Overview of vehicle assets and their allocation for operational needs.

Driver Distribution

Overview of driver allocation for interstate and intrastate routes, helping identify resource distribution.

Cross-State:
5

Distance Breakdown

Analysis of trip distances categorized by interstate (cross-State) and intrastate (in-State) operations to optimize planning.

Fleet

Essential insights into the composition and reach of the driver workforce.

Fleet Information

Fleet Size: F

Breakdown of fleet composition, including owned and leased vehicles, to assess operational capacity.

Inspections

Report #
State
Date
Driver Violations
Vehicle Violations
Unsafe Driving
Driver Fatigue
Substances/Alcohol
Vehicle Maint.
AANZ001279OR2022-07-01000000
0197M41GWQAZ2022-05-25100000
22JH000437UT2022-05-12000000
2917M2IPF4NM2022-03-31000000
0318000196AZ2022-03-10100302
6546M1JDC5NM2022-02-24000000
6558M1JD8HNM2022-02-24000000
PF06303143CO2021-11-05100100
Showing 1 of 4

Inspections per year

Inspections per 100K miles (2022)

8

Total Inspections

30

Safety Inspection Results

Failed Safety Inspections

3

33% Higher

than national average.

Driver-Related Safety Failures

3

32% Higher

than national average.

Vehicle-Related Safety Failures

0

4% Lower

than national average.

Inspection Map
Visualization of inspection data across the United States.

Violations

Insp DateCategorySevere FailureViolation Details
Showing 1 of 8

Violations per 100K miles

20

100% Lower

than national average.

Total Violations

71

468% Higher

than national average.

Crashes

REPORT #
DATE
STATE
FATALITIES
INJURIES
TOW AWAY
LICENSE NUMBER
AZ000370269409-NOV-20AZ00YCM26019
AZ000388565618-FEB-22AZ00YCK91146

Amount of Crashes

2

Fatalities

0

Injuries

0

Number of Tows

2

Tow Rate:
100.0%
Number of fatalities per year
Number of injuries per year

Incidents by season

Incidents by weather condition

Incidents by road surface condition

Incidents by light condition

Crash Map
Visualization of crashes data across the United States.